
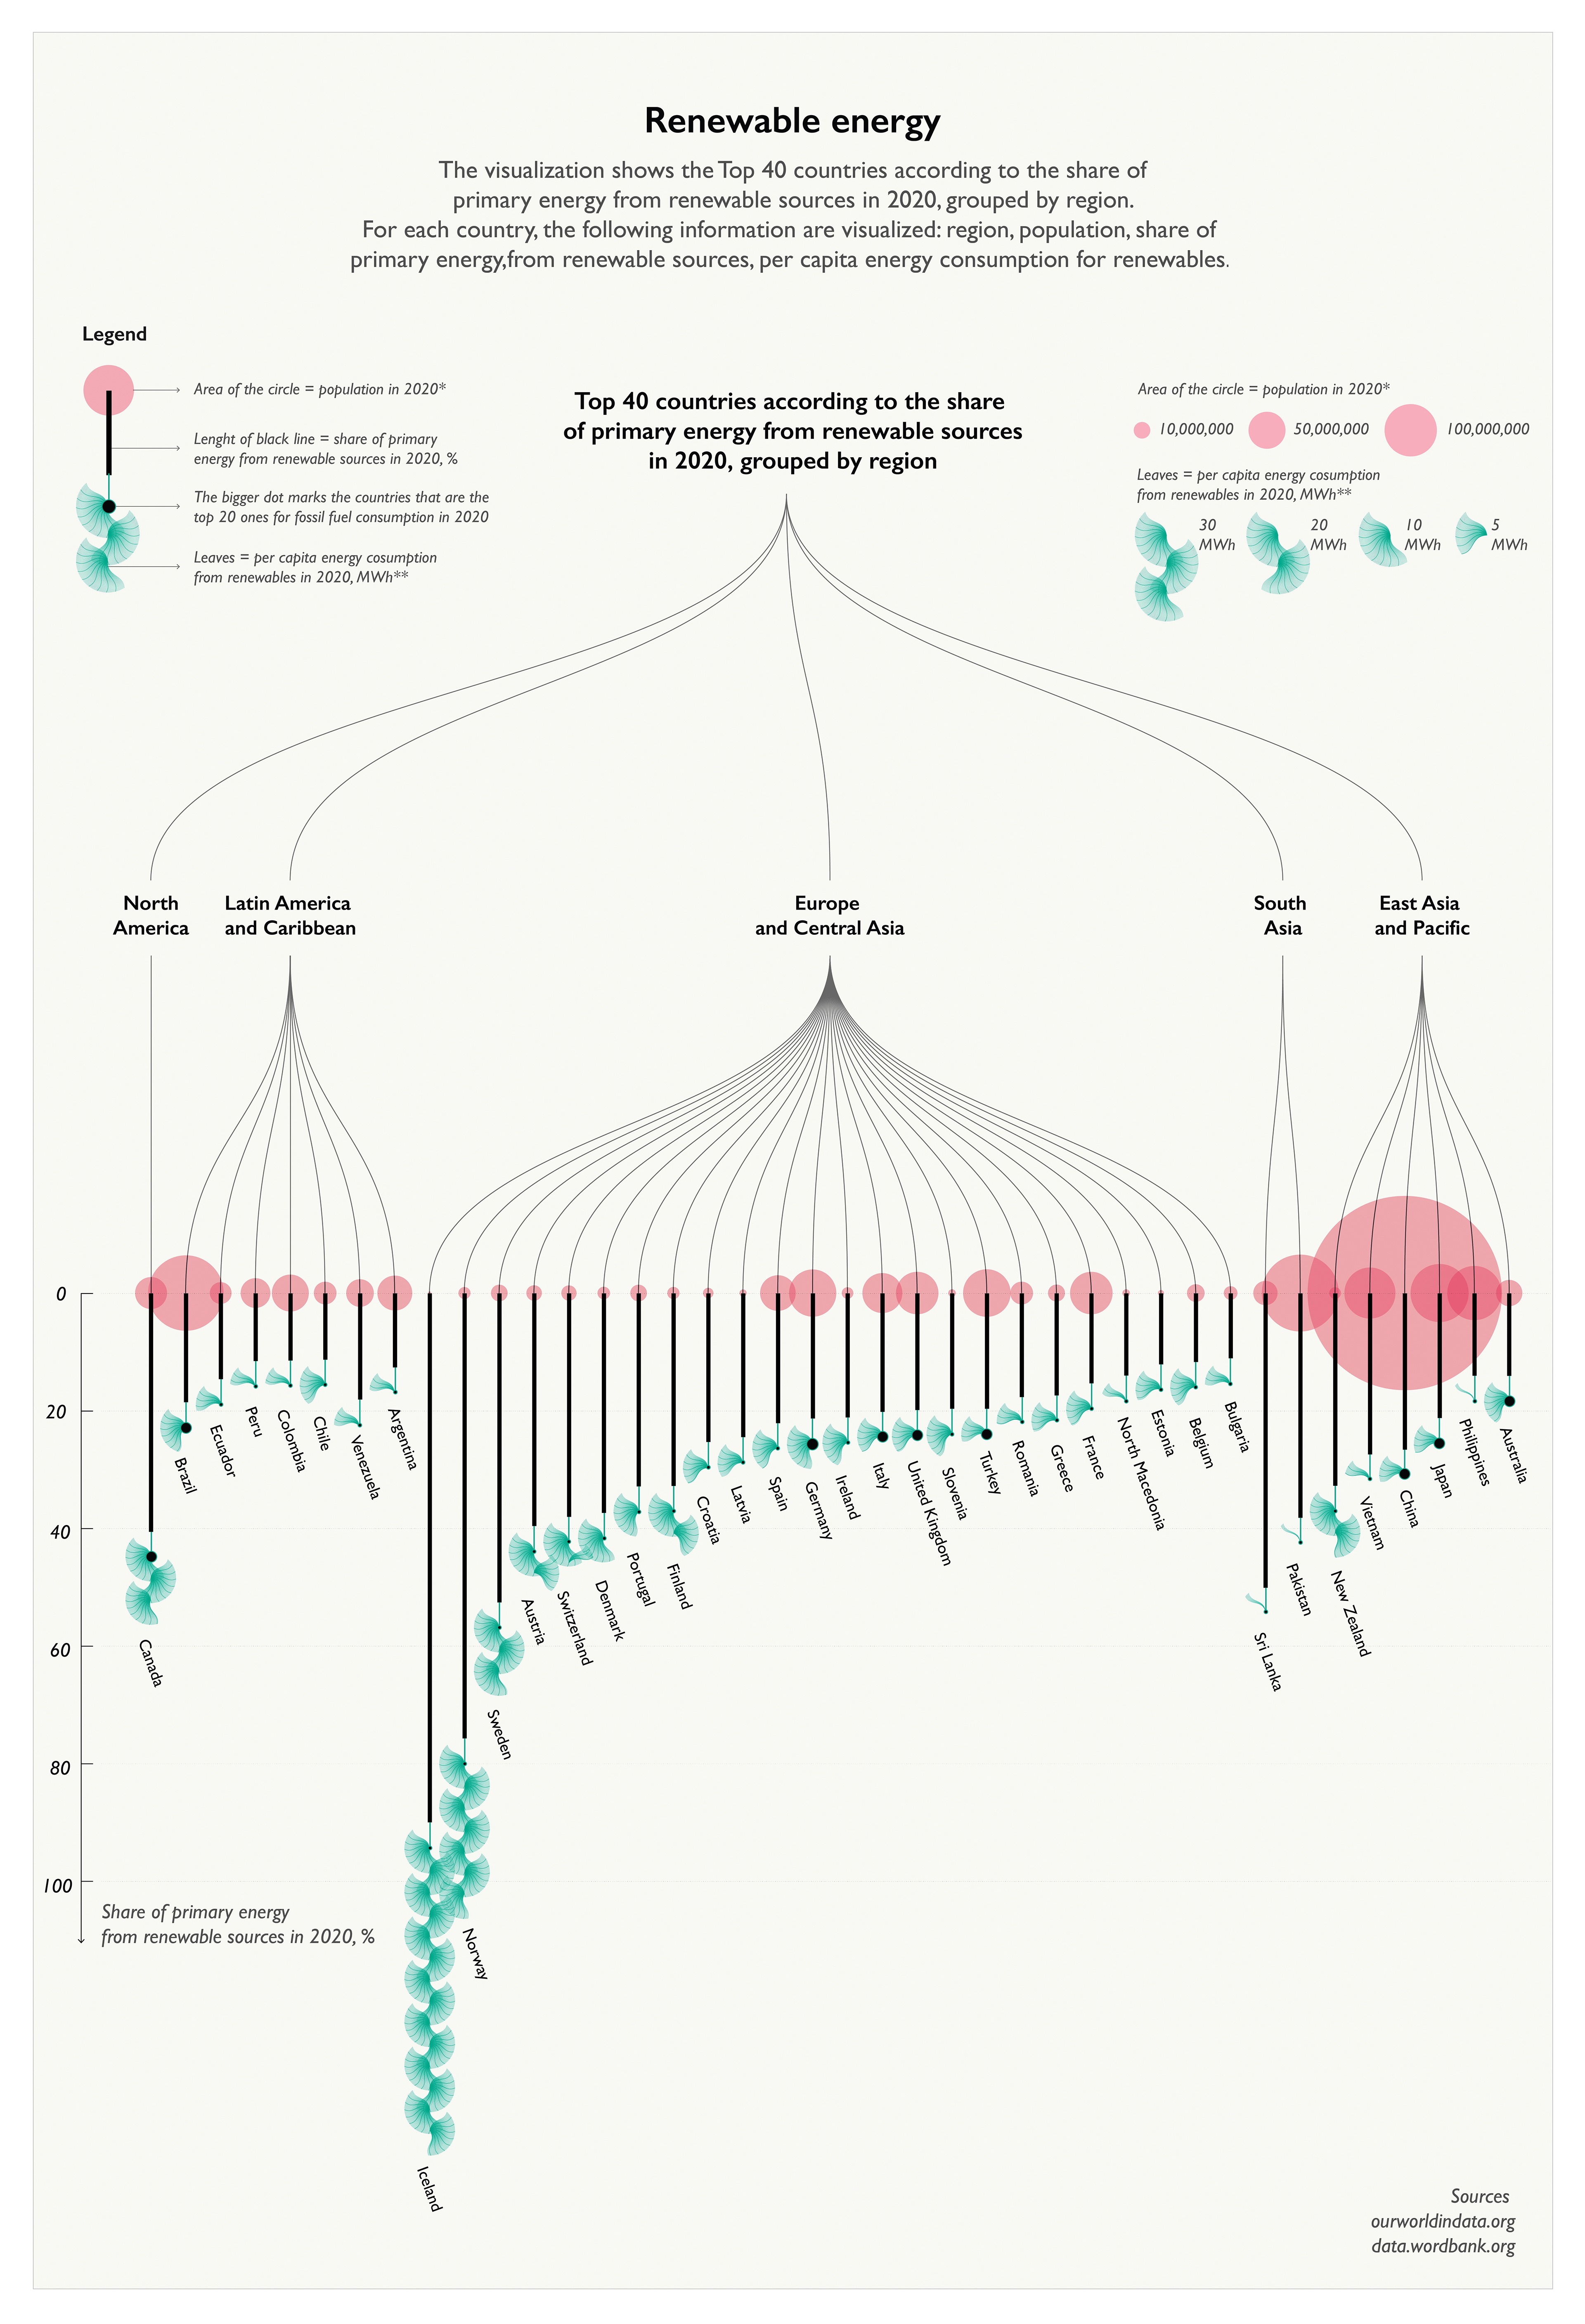
"A data visualization is a display of data designed to enable analysis, exploration and discovery"
The purpose of this project was to break the traditional methods of presenting data. Pie and graph charts don't engage the reader. They state the facts but don't invite for exploration and discovery. There is no storytelling beyond the displayed data. On the contrary, the usage of organic elements boosts creativity and gives the extra favour that makes the data very "tasty" and easy to consume.
DESKTOP VERSION
MOBILE VERSION

PRINT VERSION
